Despite various attempts to slow Canada’s hottest real estate markets, housing affordability continues to be a problem in most major urban markets. The imbalance in housing supply and demand continues to fuel persistent and prolonged property market price increases. This was true even during the economic restrictions imposed by the COVID-19 pandemic.
This disconnect between supply and demand is so bad that by March 2022, the national house price index for all property types in Canada was an astronomical $816,720. This meant a year-over-year increase of 20.6%, at the historical peak of the spring selling season. What’s worse is this one-year price appreciation is just part of an ongoing trend. Today, the benchmark price for a single-family home is just under a million (at $964,500). Five years ago, that same home would’ve sold for $556,800.
Rapidly escalating housing prices are greater fodder for debate. It’s also why various micro and macro-tools have been introduced—all aimed at helping to ease demand and increase supply and find market equilibrium.
The most recent efforts were a series of policies aimed at curbing speculation and investment in housing. Introduced in the 2022 Federal Budget, these new regulations, initiatives and taxes are an attempt to find the right lever to achieve Canadian housing equilibrium prices.
But will these new measures work?
To appreciate the potential and risk of current mechanisms and proposed solutions, it’s essential to understand what factors impact the real estate market. These factors can range from high-level macro regulations to micro-issues and regional policies. In a nutshell: It can get complex.
To help, here’s a bird’s eye view of the economic indicators used to track and monitor the real estate market, plus a quick look at the four biggest factors that impact the law of supply and demand in real estate.
The Law of Supply and Demand
The law of supply and demand is a theory that explains the basic economic principle between scarcity and price.
When demand is high for a good or service, there is upward pressure and this prompts prices to rise. With sustained demand and rising prices, more supply is introduced. Eventually, the supply of a good or service should exceed the demand and prompt a fall in prices.
As an economic principle, supply works against demand—until there is a balance. The theory is based on the assumption that people will pay more when there’s a real or perceived scarcity of a good or service. There’s also an assumption that as prices rise, people will begin to decrease their demand.

When supply equals demand, the market is balanced and this results in a market price that economists call the “equilibrium price.” All of this assumes that all other factors remain equal.
Key Takeaways
- The law of supply and demand exists in virtually any market industry.
- When demand is high, but supply is low, prices typically rise.
- When the market has plenty of supply, prices typically fall as buyers have more choice (and sellers face more competition).
Real Estate Supply and Demand
Canada’s housing market is heavily influenced by the law of supply and demand—and also exemplifies this economic principle.
In almost all residential real estate transactions there is a seller—the supplier—and a buyer. When there are more buyers than supply, the price of the home increases—or the seller can demand higher prices. When there is more supply—more homes for sale—than buyers looking, then buyers can demand lower prices.
Within the real estate supply and demand marketplace, there are a variety of participants. On the demand side the main participants in Canada’s real estate markets include:
Owners: People who purchase real estate as a place to live. While owners can be classified as investors, they aren’t truly investors, as their property purchase is prompted more by lifestyle factors and not based on cash flow or future earnings potential. As such, owners are pure consumers in the real estate marketplace.
Renters: Like owners, renters are consumers in the real estate marketplace—consuming housing to satisfy a need.
Investors: Investors are also consumers but with different end goals. They can be owners—living in a property, while renting it out—or landlords. Investors purchase real estate (either residential or commercial) as a way to earn income or realize a profit.
On the supply side the main participants in Canada’s real estate markets include:
Developers: These people are involved in developing raw land or redeveloping older-stock buildings and then selling the property in the market to earn a profit.
Renovators: These people redevelop older properties and resell the refurbished supply in the market to earn a profit.
Transactional Facilitators: This group includes banks, credit unions, lenders, real estate brokers and agents, lawyers, government regulators, and any other person, business, or organization that help facilitate the purchase and sale of real estate.
The relationship between real estate users as well as supply and demand creates a push-pull relationship that can exist at the micro-level—per address, property type, or area—or at a macro-level. As a result, it’s not always easy to measure supply and demand—and not always easy to predict the ultimate impact each factor will have on the marketplace. Many factors influence a buyer’s decision to bid and buy a home, while many other factors influence the supply of homes for sale.
To help, consider the following takeaways then consider how best to monitor the housing market cycles using the three standard economic indicators. Finally, we examine the four biggest factors to influence supply and demand in the real estate market—and, ultimately, impact housing prices across Canada.
Key Takeaways
- The housing market is an example of how supply and demand will work in industry and in a market sector.
- In general, the residential housing market is a push system: Where the number of sellers and buyers is not controlled.
- Pull factors can influence this push system.
- The housing market is complex with various relationships and a multitude of inputs that can shape and define outcomes. This results in unpredictability.
3 Economic Indicators to Help Predict Canadian Housing Market Cycles
When analyzing any economic marketplace, most analysts will consider three types of economic indicators: leading, lagging, and coincident. Each indicator provides insight into potential housing market trends by providing information on future changes, past trends, and current influences.
Leading indicators address potential future changes in industry or the economy. Generally, leading indicators are best used when making short-term predictions, since these indicators measure factors that change before major shifts in an industry (or economy). In housing, a leading indicator acts as a signal of potential future demand in the real estate market. Leading indicators typically focus on factors that exist before demand increases.
Lagging indicators measure changes after the economy changes. They help confirm trends—and these trends are used to make predictions, and establish policy based on those predictions. In the housing market, a lagging indicator follows the trend in the demand of a real estate market. While these indicators have limited use in predicting future trends, they are integral to confirming patterns and helping assess the significance of future indicators.
Coincident indicators provide information about the current state of an industry or economy. These indicators are current or ongoing—happening at the same time as larger trend shifts and changes in the industry (or region). In the housing market, coincidental indicators happen at the same time as demand.
Each type of indicator can help analysts, investors and even homeowners make smarter policy decisions and better financial decisions.
4 Key Factors that Drive Housing Supply and Demand
No housing markets exist in isolation. While direct factors, such as the current supply of new builds, will certainly impact housing supply and demand, there are just as many indirect influences. Still, to get a better grasp of Canada’s housing market, most analysts focus on four key factors:
- Costs
- Demographics
- Government Regulations
- Macroeconomic Trends
Analysts will examine the economic indicators—leading, lagging and coincident—of each of these four factors to determine what is influencing housing supply and demand, directly impacting housing prices and what trends we can expect.
To help illustrate, let’s consider how each factor helps to report and influence the housing market in Canada.
Key Factor #1: Costs
If the cost to build or maintain housing stock rises, this will push housing prices up as builders pass on these costs to homebuyers.
For instance, when COVID restrictions prompted a slowdown in lumber production but demand for lumber didn’t slow, the cost of lumber rose and renovation contractors and builders passed on these costs to the buyer (in order to keep profits and production at stable levels, and enable them to keep their workforce employed).
Materials aren’t the only costs to impact home prices. Availability of labour, taxes, subsidies, cost of development and permits, and the cost to meet regulatory requirements are all factors that can increase or decrease the cost of building and maintaining housing stock—and impact housing prices as well as housing supply.
The cost to borrow is another significant influence on housing prices. In general, interest rates, and specifically mortgage rates, directly impact both the price and demand of residential real estate. Lower mortgage rates increase demand, as more buyers rush to lock in with lower borrowing costs. More buyers mean more demand, and this results in higher housing prices.
There are also transactional costs associated with residential real estate. Demand-side users, such as buyers and sellers, need to factor in land transfer fees, GST on new builds, and real estate agent commission costs, among other feeds. Supply-side users, such as developers and facilitators, need to pay various transactional costs, such as building and permit fees or administrative costs to meet regulatory compliance. When transactional fees rise, so does the cost of housing.
Economic Indicators to Watch
Leading Indicators
- Building permits: Predict the number of new housing starts.
Lagging indicators
- Interest rates / Mortgage rates: Prime rate—the baseline to borrow—is based on the Bank of Canada overnight rate, which is determined by bond yields and influenced by US Treasury Bills, both of which shift as a result of economic and market events.
- Trend changes in residential building construction price growth
Coincident indicators
- Lumber prices: A rise in prices quite often means a rise in material costs, such as lumber prices.
Key Factor #2: Demographics
Both nationally and locally, demographics and socioeconomic trends impact the supply and demand of housing. Changing trends in housing needs and lifestyle, as well as population growth and immigration all impact supply and demand. Other trends also influence housing trends, such as changing theories about family structure, investment opportunities, and settlement patterns.
Housing demographics aren’t just about those looking to purchase, either. Another factor that impacts housing demand is the availability of secure and adequate rental units. Historically, specific, localized data on rental units has not been available. One of the biggest obstacles is the collection of accurate information on non-market rental units—suites offered by private landlords or in buildings that are not purpose-built rentals. This makes current data woefully inaccurate and decisions regarding the
Microdata on rents has historically been hard to come by, with many municipalities tracking home sale data but not rental costs. It’s also difficult to study individual people’s migration histories – where they wind up after a move and what motivated them.
Economic Indicators to Watch
Leading Indicators
- Population Growth: As a population grows, so does the demand for rental units and housing. The faster the population growth, the more demand in the region’s housing market and the faster this demand will prompt price increases (in both home sale prices and rental rates).
- Age Cohorts: Age groups will dictate housing trends and demands. Older age groups may prefer communities, such as condo complexes, while younger cohorts, who are more likely to get married and start families, may be more interested in single-family homes.
- Birth Rates: Rising or stable birth rates indicate a sustained or growing population, which is necessary for establishing future housing demand.
- Mortgage delinquency rates: More people defaulting on their mortgage debts can be a signal of poor economic conditions and increased housing costs. While this situation will usually occur during tougher economic environments, it can also be used as a leading indicator to signal a drop in future housing demands.
- Rental vacancy rates: When rental vacancy rates are low it means there is very little competition in the rental market—making it a landlord’s market. This lack of competition can prompt renters to start the process of moving from renter to homeowner—and signal a potential increase in near-future housing demand.
Lagging indicators
- Income and wages: When the economy is healthy and growing then earnings should increase to keep up with the average cost of living. When income is stagnant or declining, it’s a sign of slow economic growth. Trends in income and wages as they relate to other demographics, such as age or region, can also provide insight.
- Trending rental rates: Rental rate changes are slower moving than other market factors since most municipalities have policies in place that restrict rent increases from occurring more than once per year and, only then, based on a maximum amount that is tied to the current inflation rate. For that reason, trends in rental rates are a lagging indicator—proving a trend of increased rental demand and potential for future housing demand.
Key Factor #3: Government Regulations
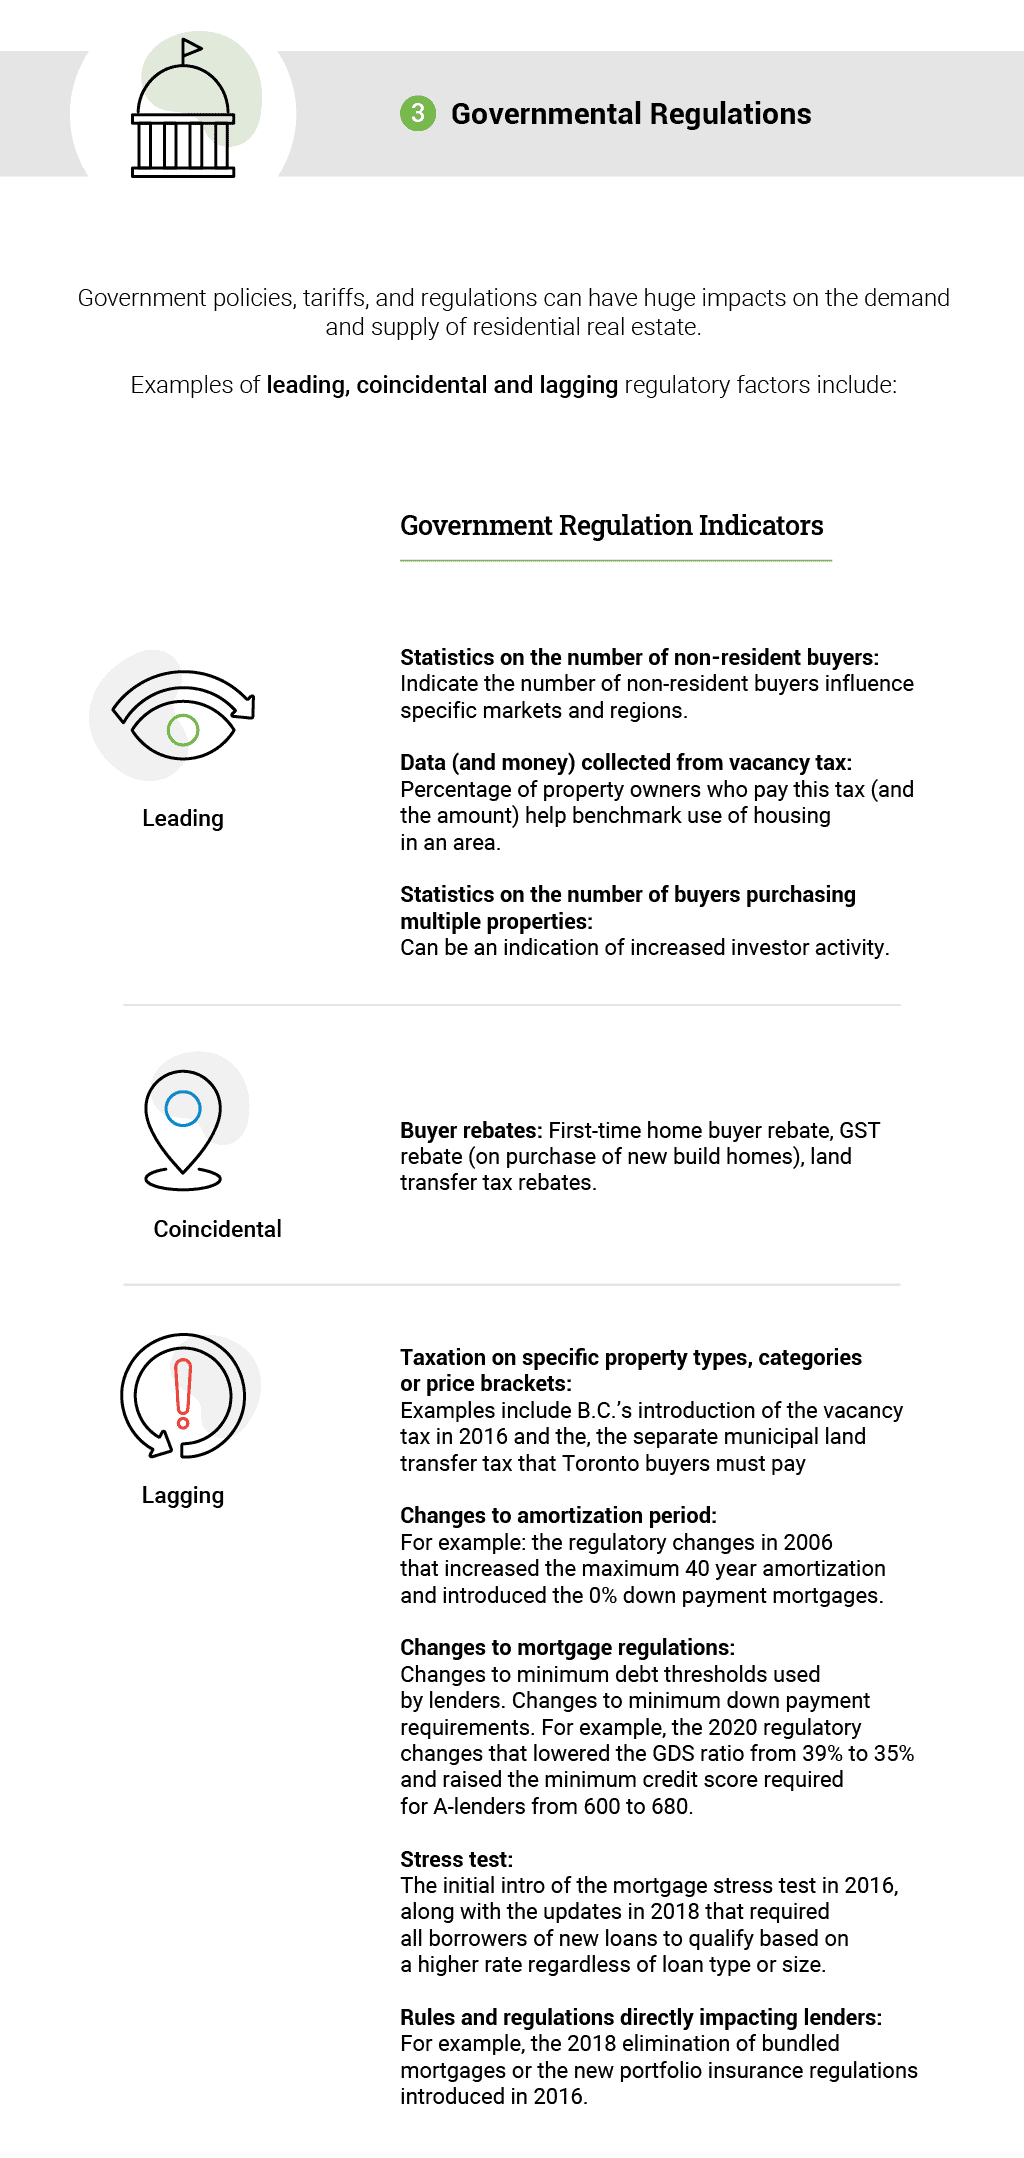
Government policies, tariffs, and regulations can boost or hinder the demand and supply of residential real estate. Building subsidies, development rebates, and tax incentives or more relaxed regulations can help increase supply, as it becomes easier for developers to add stock to the housing market and helps renovators update older stock. Increasing supply helps ease demand, which helps create more affordable housing markets in specific regions. In general, the relationship between government policies and regulations is that the lower the tariff or the easier the regulatory requirement the greater the demand and supply of housing.
Government Regulations to Watch
Leading Indicators (Predict Future Demand)
- Statistics on Buyer Intent and Residency: Number of non-residents investing or shopping for Canadian assets.
Lagging indicators (Confirm Past Demand Trend)
- Specific tax: Vacancy tax, land transfer tax, property tax
- Changes to amortization rules: For instance, in 2006 the regulations changed to allow for 40-year amortization; this was later amended to restrict 40-year and 35-year amortization periods.
- Stress test: Initially introduced in 2016 and updated in 2018, this regulation requires all borrowers of new mortgage loans to qualify based on a benchmark rate that is usually 200 basis points above current mortgage rates.
Coincident indicators (Same as Demand Trend)
- Buyer Rebates: Buyer rebates (first-time buyer rebate) + GST rebate (on new homes)
Key Factor #4: Macroeconomics
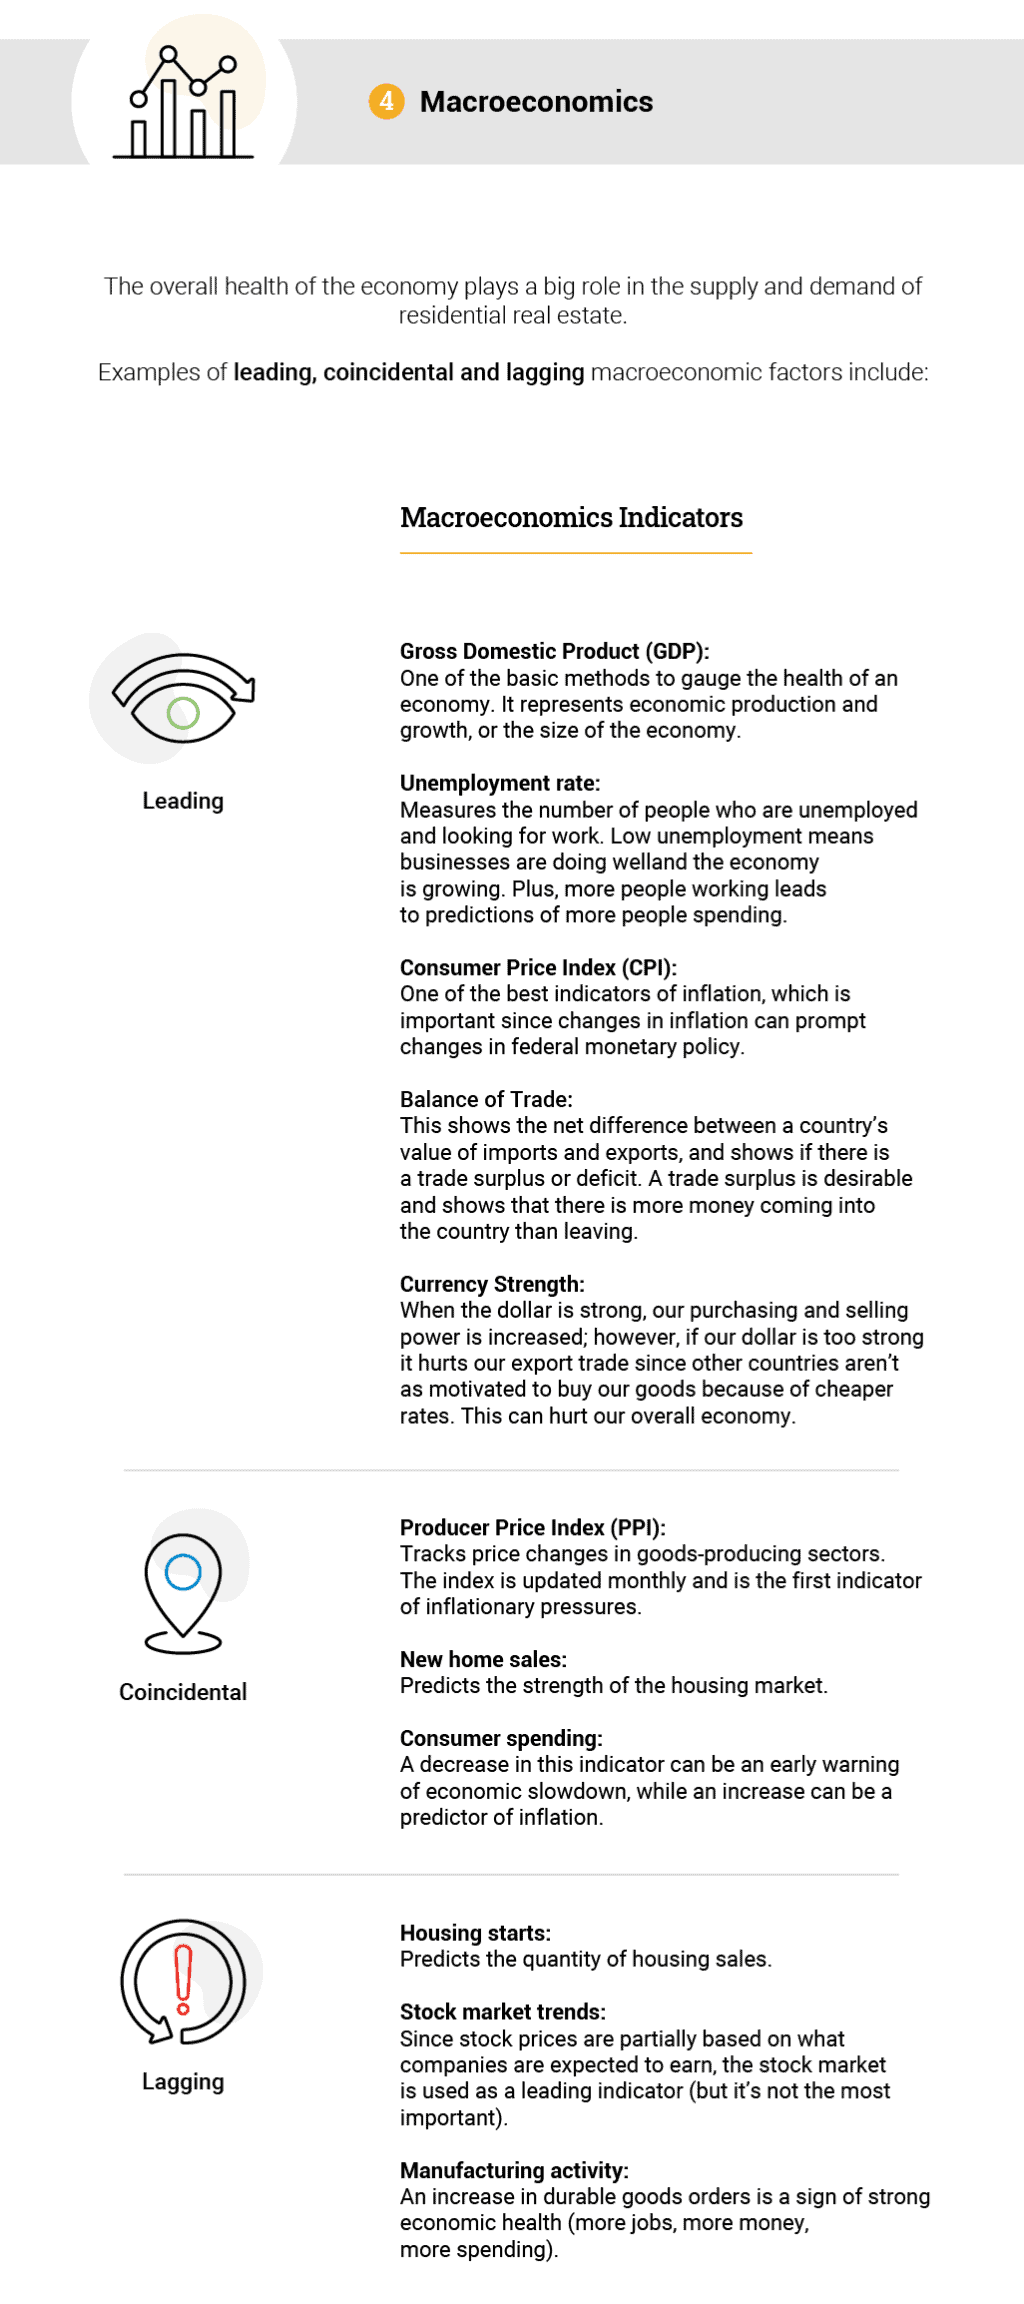
The overall health of the economy plays a big role in the supply and demand of residential real estate. Generally, economic factors are measured through standard economic indicators, such as GDP, CPI, employment rates, income as well as manufacturing activity. In general, when the economy is slowing or facing headwinds, demand for residential real estate is down.
Economic Indicators to Watch
Leading Indicators
- Housing starts: Predict the number of housing sales.
- Stock market: Since stock prices are partially based on what companies are expected to earn, the stock market is often used as a leading indicator (even if it’s not the most important indicator).
- Manufacturing activity: An increase in durable goods orders is a sign of strong economic health (more jobs, more money, more spending).
Lagging indicators
- Gross Domestic Product (GDP): GDP is one of the basic methods to gauge the health of an economy. It represents economic production and growth, or the size of the economy. Growing or stable GDP indicates economic health.
- Unemployment rate: This reflects the number of people who are unemployed and looking for work. When more jobs are created, it’s assumed that businesses are doing well and a reflection of a growing economy. Plus, more people working leads to predictions of more people spending.
- Consumer Price Index (CPI): This lagging indicator is one of the best indicators of inflation, which is important since changes in inflation can prompt changes in federal monetary policy.
- Balance of Trade: Ths shows the net difference between a country’s value of imports and exports, and shows if there is a trade surplus or deficit. A trade surplus is generally desirable and shows that there is more money coming into the country than leaving.
- Currency Strength: When the dollar is strong, our purchasing and selling power is increased; however, if our dollar is too strong it hurts our export trade since other countries aren’t as motivated to buy our goods because of cheaper rates. This can hurt our overall economy.
Coincident indicators
- Producer Price Index (PPI): This indicator tracks price changes in almost all goods-producing sectors, and for an increasing portion of non-goods-producing sectors of the economy. It’s considered important as the index is updated monthly and is the first measure/indication of inflationary pressures.
- New home sales: Predict the strength of the housing market
- Consumer spending: As a monthly report of all retail sales, a decrease in this indicator can be an early warning of economic slowdowns, while an increase can be a predictor of inflation.
4 Unique Characteristics that Impact Housing Prices in Canada

The assumption that underlies the economic theory behind the law of supply and demand is that the market can and does balance itself and, as a result, is predictable. However, there are a few unique characteristics of real estate that distort this assumption—making real estate a less predictable marketplace.
Those characteristics include:
- Durability
- Uniqueness
- Long Timelines
- Multiple Roles In the Market
Durability
While there are exceptions, the land is widely considered to be indestructible. A home or building, once built, can last for decades or even centuries. Combining the two and the durability of real estate means that stock in this economic sector lasts a very long time. This longevity of stock makes housing a highly durable good.
Since the stock of housing is durable and has longevity, the bulk of the market is measured by current stock, along with the rate of deterioration of existing stock and the rate of renovation of existing stock.
However, the quantity and quality of stock aren’t the only way housing supply is measured. Supply is also influenced by the inflows and outflows of housing. This flow of additions and deletions in housing, typically measured through building permits and housing starts, also influence the supply of housing, albeit to a smaller degree.
When you combine the flow and stock of housing with the durability of this good, we can see that market cycles can last for years, or decades or longer.
Uniqueness
A home is a home—but it’s not. While every unit of real estate is a building constructed for either residential or commercial use (or both), that doesn’t mean that housing is consistent or real estate is homogeneous.
The assorted and diverse nature of housing makes pricing difficult—and makes the comparison more laborious and difficult. The heterogeneous nature of real estate creates information asymmetry—where knowledge and data aren’t uniformly available to all players in the market. The heterogeneity of housing also restricts the ease of substitution.
Long Time Lines
The housing market does not work on a short timeline. The redevelopment of old stock and the addition of new units, through housing construction, can take months or years. Add to this the time it takes to design, finance, and meet regulatory requirements and the timeline for goods in this sector can extend well past one or two calendar years.
In addition, there is always the possibility of delays, and any adjustments—changes to regulation, addition or deletion of taxes or subsidies, or changes to zoning, to name a few—are typically slow to implement.
Multiple Roles In the Market
Housing is both a consumption good and an investment (typically, it’s classified as a long-term investment, although there are real estate strategies that work on a relatively short timeline). The multiple roles housing plays in the economy means that different players are motivated by different factors and enter and exit at different times. While the nature of both roles can be separated—track first-time buyer rebates versus payment of vacancy tax—the impact these roles have on the overall housing market economy is not as easily separated. Plus, the line between these roles can blur. For instance, a homebuyer can purchase a home as a consumption good—a place to live and raise a family—but choose to pay more than market value because of the perceived value of the home—investment motive.
Like with the development of housing stock, most of the adjustment mechanisms used to shape housing’s influence in the market are slow to implement. Although, this is not always the case, as seen in August 2016, when the provincial government, at that time, gave the industry six days to absorb the implementation (and impact) of the first B.C. vacancy tax.
The Bottom Line
There are so many factors that can affect the supply and demand for homes. Many are direct economic influences, others are indirect or not economic in nature.
To understand the impact of a tax, an updated regulation or a change in mortgage rates, we need to appreciate the transactional nature of real estate, the current and shifting demographic needs (both globally and regionally), and the various direct and indirect influences that impact the market.
While it’s relatively easy to find and track high-level factors that impact housing, predicting how these factors will work in each region can be difficult given all of the additional inputs that can influence the supply and demand of residential housing.
Still, understanding the key factors that drive the real estate market is critical to identifying problem areas or to start developing a comprehensive evaluation and plan to create and maintain a state of equilibrium within the housing market.
Infographic: Impact of Supply and Demand on Housing Prices in Canada